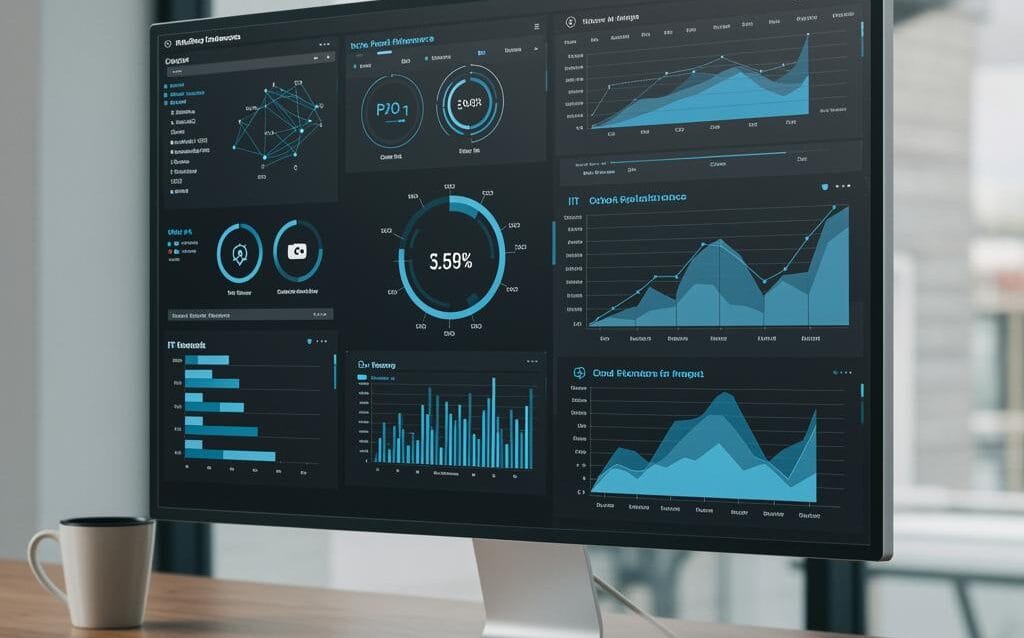
CIO Dashboard: Key Metrics for Tech Leadership
CIO Dashboard: Key Metrics for Technology Leadership
In today’s rapidly evolving digital landscape, the role of the Chief Information Officer (CIO) has become increasingly critical. CIOs are no longer just responsible for managing IT infrastructure; they are pivotal leaders driving innovation, aligning technology with business strategy, and ensuring the organization’s competitive advantage. To effectively navigate this complex role, CIOs need a robust CIO dashboard – a visual representation of key performance indicators (KPIs) that provide actionable insights into the health, performance, and alignment of the IT department.
This post will explore the essential metrics that should be included in a CIO dashboard, providing a comprehensive guide for technology leaders to monitor progress, identify areas for improvement, and demonstrate the value of IT to the broader organization. By tracking these KPIs, CIOs can make data-driven decisions, optimize resource allocation, and ultimately contribute to the success of the business.
Financial Performance & IT Budget Management
IT Budget vs. Actual Spend
One of the most fundamental metrics for any CIO dashboard is the comparison between the planned IT budget and the actual spend. This metric provides a clear picture of whether the IT department is operating within its allocated resources. Significant deviations from the budget, whether overspending or underspending, warrant further investigation.
- Overspending: Could indicate unforeseen expenses, inefficient resource allocation, or inadequate budget planning.
- Underspending: May suggest missed opportunities for investment in critical technologies or a lack of proactive spending on innovation.
Return on Investment (ROI) for IT Projects
Measuring the ROI of IT projects is crucial for demonstrating the value of technology investments to the business. This metric quantifies the financial benefits generated by IT initiatives, such as increased revenue, cost savings, or improved efficiency.
ROI can be calculated using the following formula: (Net Profit / Cost of Investment) x 100. It’s important to track ROI for individual projects as well as the overall IT portfolio.
Total Cost of Ownership (TCO)
TCO provides a comprehensive view of all costs associated with owning and operating IT assets, including hardware, software, personnel, and maintenance. Understanding TCO helps CIOs identify areas for cost optimization and make informed decisions about technology investments.
Consider breaking down TCO by category (e.g., hardware, software, labor) to pinpoint specific cost drivers.
Operational Efficiency & IT Service Delivery
Help Desk Ticket Resolution Time
The speed and efficiency of help desk ticket resolution directly impact employee productivity and satisfaction. Tracking average resolution time allows CIOs to identify bottlenecks in the support process and implement strategies to improve service delivery.
- First Call Resolution Rate: The percentage of tickets resolved during the initial interaction with the help desk.
- Average Ticket Resolution Time by Priority: Track resolution times separately for high, medium, and low-priority tickets.
System Uptime & Availability
System uptime and availability are critical for ensuring business continuity. This metric measures the percentage of time that IT systems are operational and accessible to users. High uptime is essential for maintaining productivity and preventing disruptions.
Consider tracking uptime for critical systems separately (e.g., ERP, CRM) to identify potential vulnerabilities.
Number of Security Incidents
Monitoring the number of security incidents, such as data breaches, malware infections, and phishing attacks, is crucial for protecting sensitive information and maintaining the organization’s reputation. This metric provides insights into the effectiveness of security measures and identifies areas for improvement.
Categorize incidents by type and severity to gain a more granular understanding of security threats.
Strategic Alignment & Innovation
Percentage of IT Projects Aligned with Business Goals
Ensuring that IT projects are aligned with the organization’s strategic objectives is paramount for delivering business value. This metric measures the percentage of IT initiatives that directly support key business goals, such as revenue growth, market share expansion, or customer satisfaction.
Regularly review IT projects with business stakeholders to ensure alignment and prioritize initiatives that have the greatest impact.
Adoption Rate of New Technologies
The adoption rate of new technologies reflects the organization’s ability to embrace innovation and leverage cutting-edge solutions to gain a competitive advantage. This metric measures the percentage of users who are actively using new technologies implemented by the IT department.
Track adoption rates for different technologies and identify factors that may be hindering adoption.
Employee Satisfaction with IT Services
Employee satisfaction with IT services is a critical indicator of the overall effectiveness of the IT department. This metric measures employee perceptions of IT support, system performance, and the overall value of IT services.
Conduct regular surveys and gather feedback from employees to identify areas for improvement and enhance the user experience.
Cybersecurity Posture & Risk Management
Vulnerability Patching Compliance
Ensuring timely and consistent patching of software vulnerabilities is paramount to prevent security breaches. This metric measures the percentage of systems that are up-to-date with the latest security patches.
Establish clear patching policies and procedures and monitor compliance regularly.
Phishing Simulation Success Rate
Phishing simulations are a valuable tool for assessing employee awareness of phishing attacks and identifying areas for training and improvement. This metric measures the percentage of employees who successfully identify and avoid phishing attempts during simulated attacks.
Regularly conduct phishing simulations and provide targeted training to employees who fall victim to simulated attacks.
Data Loss Prevention (DLP) Incident Rate
DLP systems are designed to prevent sensitive data from leaving the organization’s control. This metric measures the number of DLP incidents, such as attempts to transfer confidential files to unauthorized locations.
Analyze DLP incidents to identify potential security breaches and refine DLP policies and procedures.
Conclusion
A well-designed CIO dashboard is an indispensable tool for technology leaders. By tracking the key metrics outlined in this post, CIOs can gain valuable insights into the performance of the IT department, demonstrate the value of IT to the business, and make data-driven decisions that drive innovation and competitive advantage. Remember to tailor your dashboard to your organization’s specific needs and priorities, and regularly review and update your metrics to ensure they remain relevant and effective.

